System Dashboard
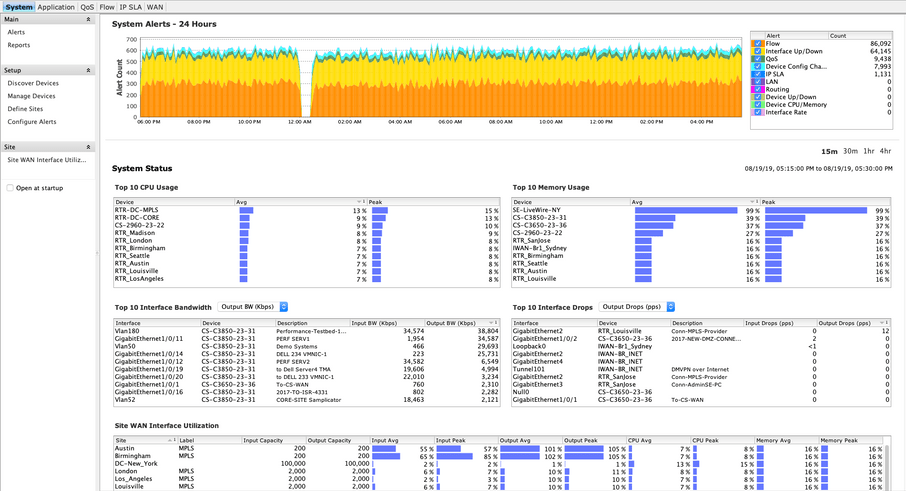
The System Dashboard presents a snapshot of the resources in the network, it lists the Alert count, and a set of widgets that display the status of Top devices in each category, CPU, Memory, Interface Bandwidth and Drops, and WAN Utilization. Within each widget the order can be displayed from Highest to Lowest, or vice-a-versa by clicking on the title bar within each widget.
Site WAN Interface in the action column will display The Site – WAN Interface report. This report provides a historical summary of the QoS properties of all the interfaces that are defined as WAN interfaces, grouped by Site tag.